On colour blindness and modelling colour perception
As it turned out in the discussion of the previous post about colour blindness, the model of vision with a shortage of red and green cones was not especially accurate.
Over the past three weeks I rewrote three times the algorithm that models disorders of colour vision, each time checking the results on real deuteranopes (a shortage of “green” cones) and protanopes (a shortage of “red” cones). And now I am ready to share with you the results of my investigations. :)
The goal of the modelling was, in fact, not even the resulting picture, but the creation of an algorithm that would make it possible to say how much more strongly, say, red is perceived than blue. Along the way it became clear that some services that model the loss of colour vision in fact simply shift the a–b coefficients in CIE Lab, and a check on real colour-blind people showed that the result was far from positive.
Because of this I had to return to theory and carry out detailed work on modelling the work of the retina of the eye in the perception of colours.
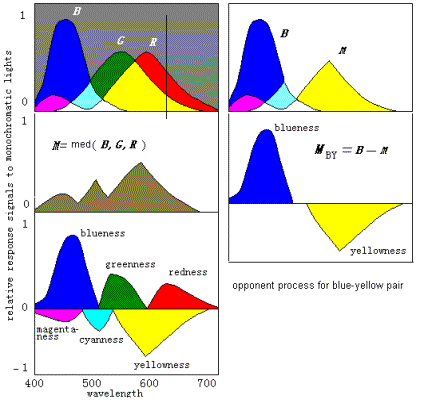
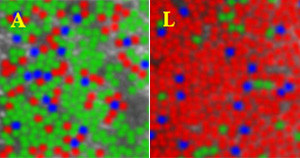
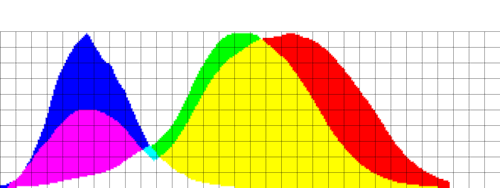
The sensation of colour depends on the level of the signal that arrives in the brain from the S, M and L cones. Yellow is perceived as a medium level of the M and L cones. Green — as the strength of the signal from S minus the strength of the perception of yellow. Red — analogously. With blue, cyan and violet it is more complicated: the maximum of the perception of L falls on violet.
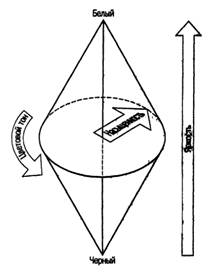
The brightest hue turned out to be red-orange; the minimal strength of perception is in the region of azure.
Modelling
Protanopia: the magnitude of the signal from the red cones decreases, the white point remains in place, but the relative level of white is lowered in the red region.
Deuteranopia: a reduction in the perception of green.
Tritanopia: the most difficult case, because of the shift of red in order to obtain magenta.
Real life
The models were tested on two protanopes (coefficients of reduction of the sensitivity of the M cones of 34% and 52%), one deuteranope (S reduced by 43%) and two tritanopes (78% and 92%).
A result of almost complete correspondence, with a divergence only in the region of magenta, was considered satisfactory. The piece with magenta has not yet been overcome — it is a difficult one to model.
I have prepared several pictures with a coefficient of loss of colour sensitivity of 60%. The rest can be viewed in the album (original, tritanopia, deuteranopia and protanopia).