Vision Modelling. Part Two. Perception
1 Excursion into the eye — 2 Perception — 3 Geometry of vision — 4 Eye tracking — 5 How to catch the gaze — 6 Modelling eye tracking
This post is about certain peculiarities of human perception that take place still at the level of the retina of the eye (before the picture is analysed in the brain). The points directly connected with the theme of the posts are set in bold. If some of the terms are unclear, see the first part.
Peculiarities of colour perception
The principal parameters of colour are hue, brightness and saturation, corresponding to a complex of physical parameters of reflected light: wavelength, intensity and spectral purity.
Brightness. The higher the intensity, the brighter the colour appears. At one and the same intensity, however, some colours seem brighter than others (yellow versus blue, for example). This has to do with the distribution of the numbers of cones of different types and with the kinds of colour they perceive (yellow, for instance, is perceived by two kinds of cones at once, and for that reason it is considerably more intense than blue).
Spectrally pure monochromatic light is maximally saturated; if, however, one adds to monochromatic light some light of another wavelength, or white light, the colour will be perceived as less pure and, on the other hand, brighter.
The diagram of the three-dimensional colour spindle illustrates the relationship between hue, brightness and saturation (the illustration is from Harvey Schiffman’s book Sensation and Perception):
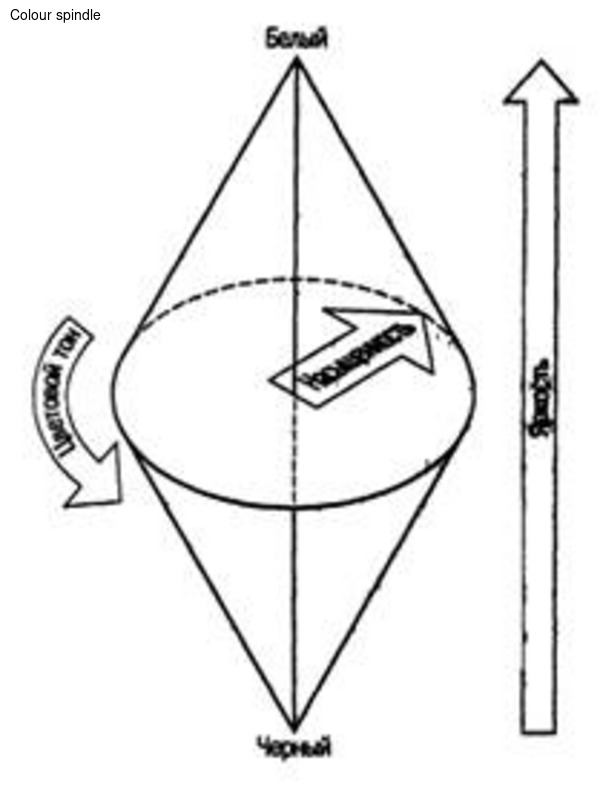
The axis of the spindle represents all shades of grey; the perceived sensation of saturation is shown by the disc and increases from its centre toward the edges.
The diagram clearly shows that saturation is maximal only at medium levels of brightness; when brightness increases or decreases, the sensation of saturation falls.
Newton’s colour circle corresponds to the central disc of the spindle at the level of maximal colour saturation. The colours are arranged around the colour circle so as to emphasise certain regularities in the perception of colours.
Each colour has its complementary colour, which occupies the diametrically opposite position on the colour circle. A mixture of complementary colours, taken in a certain ratio, produces white or grey. Pairs of complementary colours are antagonist colours, since they cancel each other’s influence on the visual system.
Examples of complementary colours: blue and yellow, red and blue-green, green and purple — and purple lies outside the colour circle, since it has no wavelength of its own, but is a sensation that arises when spectrally pure colours are mixed.
Colours that evoke the same sensations but have a different physical nature are called metamers. An example of metamers is spectral green, obtained by splitting white light through a prism, and the green obtained by mixing yellow and blue paint. Colours may be additive or subtractive. A good account of how colours are composed is written here, and since the colour model does not quite fall within the bounds of a discussion of how a picture is perceived, what has been said above is enough about colour. This fully explains the perception by the human eye of a group of pixels on a monitor.
Peculiarities of the retina’s work
As a result of a great many experiments, the conclusion was reached that a person perceives a change of colour and illumination exclusively at boundaries. For example, the Mach illusion:
It seems that the edges of the rectangles are underlined. What is more, the left-hand boundaries of the rectangles seem lighter than the right-hand ones, although in reality they are painted uniformly. Mach bands show that, still at the level of the retina, contrast boundaries are emphasised and perceived more strongly. Or take this illusion of lightness contrast:
The inner squares are identical in brightness, but are perceived differently because of the background. The same applies to the perception of colour:
A colour seems brighter when surrounded by a complementary background.
Thus, even before the analysis of visual information and the recognition of images, the impression of the outer world is transmitted from the eye to the brain already in the form of a set of various contours and of colour and brightness information about various regions.
Boundaries and their discrimination
A boundary is perceived by the retina as a change in some parameter (brightness, hue, length or direction). For a boundary to be sensed, the retina needs the difference in intensity to exceed some threshold value.
In the course of experiments it was found that the perception of signals obeys a relation known as Weber’s law: “In order for two signals to be distinguished from each other, the difference between them must be proportional to their absolute magnitude”
In the course of the same experiments it was found that the coefficient k in this formula is equal to approximately 1/60. What might this mean as applied to computer colour? The gradations of brightness in the RGB colour model correspond to 256 values from 0 to 255. Thus, if a lighter square is placed on a black background (brightness 0 in the RGB model) and the eye is to fix the boundary of that square with certainty, the brightness of the square must be no less than 5.
And what about gradients? How is the smoothness of an increase in brightness perceived? For the perception of smoothness another relation is important, known as Fechner’s law:
Accordingly, in order for the increase of the signal to be felt as smooth, I must change exponentially. The coefficient k in this equation is the same coefficient as in Weber’s law.
The next relation, known as Stevens’ power law, tells how strongly a change in the signal is perceived. For example, how strongly a difference in brightness is perceived, or the “lengthiness” of a line:
in this equation the coefficient k no longer has anything to do with Weber’s constant and depends on the choice of metric scale, while the coefficient b is a computed constant that depends on the kind of stimulus.
For brightness in the dark, b has been determined experimentally as 0.33; for the perception of length — 1.0. Thus, in the case of the perception of length the relation takes the form:
that is, the strength of the perception of length is directly proportional to the length, and a line of 2 centimetres seems twice as large as a line of 1 cm.
1 Excursion into the eye — 2 Perception — 3 Geometry of vision — 4 Eye tracking — 5 How to catch the gaze — 6 Modelling eye tracking