
The World Through a Chick's Eyes. Part One: Color and Perception
1. On the Color Vision of Humans and Chickens #
In my previous article on modeling cat vision I promised to show the surroundings through a chicken's eyes. Once I started working, I realized that the description should be split into two parts: the first is about tetrachromacy and color vision, the second is about viewing angles and binocularity, about visual acuity, focusing and the brain's reconstruction of the picture of the surrounding world, and, finally, the model itself, which lets a human try to understand what it is like to see everything over the top of a beak.
And along the way we will try to answer an old philosophical question: “Is it possible that what I experience as red, another person experiences as green — so that neither they, nor I, nor any outside observer could ever tell?” Let us begin with how a human sees the world, or more precisely, with the topic of this article: the interesting features of color vision.
Historically, most of the tetrapods that crawled out onto land (which include amphibians, reptiles, birds and mammals) have tetrachromatic vision, that is, they can distinguish not only blue, red and green, but also ultraviolet as a separate color1–4.
But the historical ancestor of humans lost the ability to distinguish half of the colors from this set: most mammals have only two types of color photoreceptors2,7, having lost the ability to see blue-green, as well as to tell red from green. The leading explanation is that this very ancestor led a nocturnal lifestyle and had no use at all for these colors5,6.
Later on, the part of the mammals that became primates, living a diurnal lifestyle, for some reason needed to distinguish red and green tones (there are several different hypotheses about this). As a result of a mutation, the red receptor split in two8,9; the new type of receptor got its sensitivity zone in a shorter-wavelength range and became what we call the green cone (not to be confused with the blue-green receptor of other animals, such as amphibians and reptiles! We will come back to this later). And although the difference between the sensitivity zones of the red and green receptors is not that large, primates gained the ability to separate red and green shades. And on top of that, new colors appeared for them: yellow and orange.
While we are at it, it is worth mentioning rods — another type of receptor in the retina. They are very sensitive and work mostly at dusk, in dim light, when cones no longer get enough photons; in the daytime, in bright light, rods “go blind” (saturate) and practically do not take part in color vision. Nevertheless, at low light intensities, in the twilight range where both cones and rods work, they can contribute to better color vision, adding a fourth signal10. Rods are most sensitive to blue-green tones (maximum at about 500 nm).
So, humans usually have 3 types of color receptors, called S, M, L, or blue, green and red cones. There are also people with deviations in color vision. Some lack one cone type altogether, which causes dichromacy: protanopia without L, deuteranopia without M, tritanopia without S. More often, the cone is present but its sensitivity is shifted. In deuteranomaly, the most common variant, the green M cone is shifted toward red, closer to L; in protanomaly, the red L cone is shifted toward green. In both cases the M and L curves come closer together, and red–green discrimination gets worse, not better.
Some people may have a fourth type of cone, usually a shifted variant of L or M, which gives true tetrachromacy — the ability to distinguish shades in the green–yellow–red part of the spectrum that look identical to ordinary trichromats.
Humans do not see ultraviolet — at least not without removing the lens, which is a natural UV filter. People whose lens has been removed (aphakia) or replaced during cataract surgery with an artificial lens without a UV filter start to see the UV region down to 370 nm11; however, this is not very good for the retina, and in this case doctors strongly recommend wearing sunglasses. But there are also examples of mammals that do not have such a UV filter and that can quite well see part of the ultraviolet range with their blue receptor, for example mice12,13.
By the way, the transmittance of the lens depends strongly on age. In children (up to about 10 years) it is still very transparent: in the “window” around 315–320 nm up to three quarters of the light passes through it, a significant part of the 320–400 nm range also reaches the retina, and they are able to see near ultraviolet as a pale violet light. But over time the lens accumulates pigments and this window closes: in young people (20–29 years) only a few percent of UV-A gets through, and the lower limit of the visible spectrum shifts to 380–390 nm; by middle age near ultraviolet is blocked almost completely, and by 60–70 years the limit creeps into the visible range, to 400–420 nm and beyond14,15.
And it is not only ultraviolet that suffers: with age the lens turns yellow and transmits the whole short end of the spectrum worse — violet and blue tones. For example, going from the 40–59 age group to the 60+ group, transmittance at 420 nm drops by about 40%, and at 580 nm (yellow) by only 18%16. This is why deep violet may look almost dark gray to elderly people. And if we also take into account the age-related narrowing of the pupil, then by 70–80 years the retina starts to receive several times less light at the wavelength of blue (about 460 nm) than at 20 years17.
Returning to human color vision, here is what it looks like:
In the upper left corner are the sensitivity graphs of the human S, M, L receptors18–21 to a pure spectral wave. In the upper right corner is an animation of the full color gamut: all the colors a human can possibly see (well, at least as far as a display can reproduce them). At the bottom are 5 strips illustrating the human color gamut at different color saturation.
I will dwell separately on the last two diagrams, because the terminology presented there will be used further on. For color coding it is often convenient to use the HSV model — Hue, Saturation, Value.
Hue is encoded on a color wheel, where red, green and blue each have their own polar coordinate — the rotation angle that points to a color or a mix of colors. You can see such a color wheel in the animation in the upper right corner.
Value (brightness) is encoded as a linear quantity from 0 to 100%, where 0 is black and 100 is the lightest.
Saturation is encoded, like brightness, from 0 to 100%, where 0 saturation means the absence of any pronounced hue (shades of gray), and 100% is the most vivid color.
Later in this text I will often mention saturation, and sometimes brightness as well.
2. The Spectral Color Space of the Chicken #
Let us look at the sensitivity diagram of the chicken's visual receptors. Besides S, M, L, as in humans, the chicken has a fourth type of receptor, sensitive to ultraviolet, called V cones22–25,28. As on the human cone sensitivity graph, all curves are normalized to the sensitivity of the most sensitive receptor; in the chicken, unlike in humans, this is V.
A short clarification. Although we also call the chicken's receptors V, S, M, L, these are merely convenient designations by wavelength range, not an indication of kinship with the like-named human receptors. Genetically, the chicken's V cone corresponds to our blue S receptor, only shifted toward a shorter-wavelength region12. But the chicken's blue S receptor and green M receptor are exactly those blue-green and green receptors that mammals lost2,7. And only the chicken's red L is related to our red, from which the human green M later split off. This is described above.
So the set of receptors in the chicken is arranged quite differently from the human one, and the picture of the color gamut turns out to be completely different. Further on we will go through all of this in detail.

Let us immediately settle how we will display the UV component of color. Purple (magenta) is already “taken” in human vision as the mixture of red and blue, but we still need a way to show ultraviolet. From here on, color noise will be used to show ultraviolet. When mixed with other colors, it slightly raises or lowers both the brightness and the saturation of the color it is mixed with. The density of the noise indicates the intensity of the effect on the V cone.
The diagram below shows the basic colors — red, yellow, green, cyan, blue and magenta — mixed with ultraviolet. For each color, the vertical axis shows brightness from 0 at the bottom to 100 % at the top, and the horizontal axis shows the increase of ultraviolet from 0 to 100 %.
Now let us compare the perception curves of the human and the chicken on one diagram:
On the perception diagram, the human curves are at the top, the chicken curves are at the bottom, and the colors of the spectrum are drawn as a strip in between.
As the curves show, compared with the sensitivity of the other cones, the chicken's UV sensitivity is much higher, so under different levels of background UV illumination the chicken will see the remaining spectral colors differently.
Let us try to model this:
But it is important to note one more essential detail: both humans and chickens tell neighboring pure spectral colors apart by measuring the level of excitation of the cones of one or several receptors. If the signal falls into the zone of only one cone, as with long-wavelength red or short-wavelength blue in humans, then neighboring colors cannot be told apart; only their brightness will change.
The perception of intermediate colors becomes possible only when there is a way to measure the difference between the excitation of receptors of two or more different types.
For example, in most mammals, with the loss of the blue-green and green receptors, light falls only into the sensitivity zone of either S, or L, or the zone where they overlap. As a result, a dog sees only blue, yellow and a gradient from blue to yellow in the zone where S and L overlap. In humans, with the addition of M cones, it becomes possible to also see the difference between green and red, but the resolving power that allows neighboring shades in the green–red region to be told apart depends directly on the difference between the excitation levels of M and L for that wavelength.
This means that when a spectral color falls on a pair of different cone types in a zone where the difference in receptor response is small, neighboring shades will be distinguished from that color worse than when they fall into a zone where the difference between signals is larger.
The distribution of the sensitivity maxima of the S, M, L cones in the chicken differs from the human one, as does the width of the signal capture, which means that the strength of perception of the difference between pure spectral shades must differ as well.
This, by the way, sheds some light on the old inverted-spectrum question, going back to Locke and put in its modern form by Sydney Shoemaker and Ned Block: “Could it be that my experience of red is phenomenally identical to your experience of green, even though all our behavioral and functional states are identical?” The perception of pure spectral colors is tied to the physical wavelength and to the level of excitation of neurons from the receptors.
If we take as a given the picture of full-spectrum perception for humans (after all, all monitors are calibrated to match this spectrum as closely as possible), then we can recalibrate this spectrum strip by the difference between the perception levels of humans and chickens, to get the following diagram:
In the diagram one can see a pronounced dark band in the violet region. The point is that spectral violet looks reddish-blue to humans because short wavelengths weakly excite the L cones as well as the S cones; the same S + L combination from mixing red and blue light gives the non-spectral purple. For the chicken this does not apply, since it has a V type of receptor, but more on this below.
The bottom row of the diagram shows two curves on which the distortions are built (the horizontal axis shows the hues R, Y, G, C, B, M): orange is the degree of hue blur (the higher the curve, the worse the chicken distinguishes shades neighboring that color), light blue is color saturation relative to the human (the lower it is, the more the chicken falls behind the human in discrimination). They show that the chicken's discrimination is uneven. It distinguishes neighboring shades noticeably better than a human in the regions of blue (about 450 nm), green (510–520 nm) and yellow-orange (570–580 nm): for example, the chicken will tell two neighboring yellows apart about twice as well as a human. But in the region of light blue and cyan (470–500 nm), and of orange and red (600–640 nm), it distinguishes shades much worse than a human. For the violet–blue edge of the spectrum (below 430 nm) discrimination is weak in both.
Let us draw a diagram that illustrates the resolving power of human and chicken color vision across pure spectral shades:
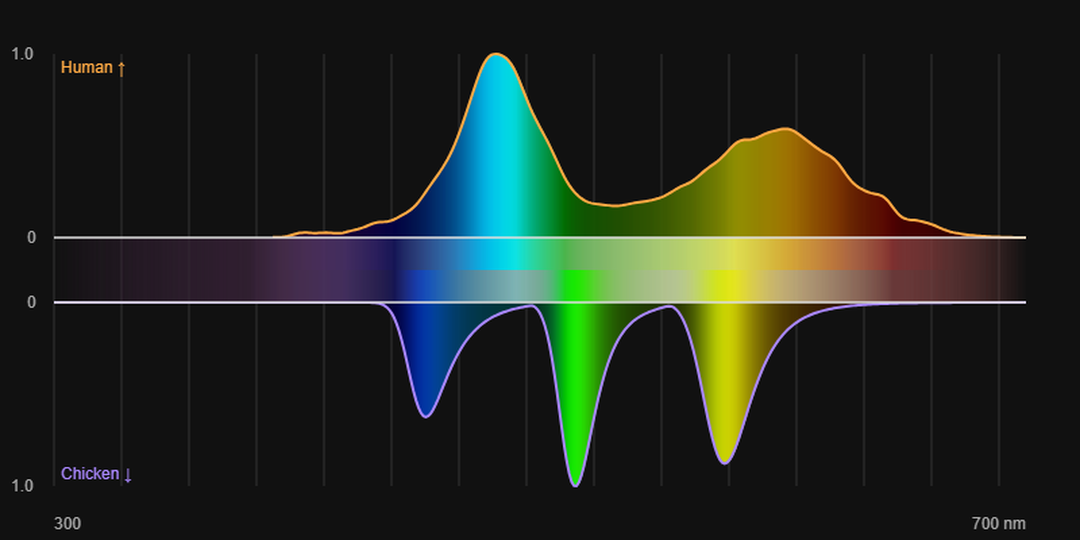
In the center, the strips show a comparison of how strongly neighboring colors are discriminated: the worse a human distinguishes shades, the paler the spectrum is shown in those places (the upper strip in the center), and likewise for the chicken (the lower strip in the center).
The Receptor Noise Limited (RNL) model, proposed by Misha Vorobyev and Daniel Osorio35, is a standard tool for predicting color thresholds in animals, especially tetrachromats — birds, reptiles and others26,27.
The main assumption of the model is that the threshold for discriminating two colors is determined solely by noise in the photoreceptors (shot noise + neural noise), not by later neural stages. Color distance is calculated in a space normalized to the noise of the individual cone types.
The model does not require knowledge of specific opponent channels and is therefore especially convenient for species whose opponent neurophysiology is poorly understood.
3. Let Us Try to Draw Color Wheels for Humans and Chickens #
For humans the color wheel is generated simply: there are three primary colors, and each pair of them makes up the colors that a human sees.
But humans have one virtual color: a mixture of red and blue giving purple (magenta). In the spectrum there is no wavelength for this color, so the sensation of this color arises right in the brain by summing the excitation signals from the blue and red cones. And if there is also a signal from the green cone, the human gets the sensation of white.
The chicken, however, has an additional cone. What does this mean?
- First, new virtual colors should appear:
- UV-green (the sensitivity of the M cones hardly overlaps with the sensitivity of the V cones);
- UV-red (similarly: the sensitivity of the L cones does not overlap with the sensitivity of the V cones).
- Second, new transitional colors should appear, just like our yellow between red and green, and cyan (light blue) between green and blue.
- And finally, the sensation of white should arise for it only when the signals of all four cones are balanced. If there is no ultraviolet in the received signal (for example, under artificial lighting with a “white” color temperature), then a mixture of only blue, red and green spectral colors should be perceived by the chicken as some new, separate color.
Let us try to model the color wheel “head-on”, placing around the circle in sequence red, green, blue, ultraviolet, green + UV, red + UV, then blue again, so that one wheel gives all possible pairwise combinations. For better expressiveness we will change the strength of the light for the transitional tones: where the distinguishability of shades is higher than in humans, saturation is boosted, and where it is lower, it is, conversely, reduced. And ultraviolet, as before, we will denote with color noise.
Since a human mostly does not see UV, only the color component from the mixing of the two colors remains in the right part.
4. What Happens in the Chicken When Two Pure Spectral Colors Are Mixed (for Example, in Reflected Light) #
But this naive approach to drawing the color wheel has one problem: most of the time we, and the chicken too, perceive not pure spectral lines but mixtures of several light frequencies at once. Moreover, one frequency can excite several types of cones at once, as was visible in the spectra above. So the combination of light rays is not just a sum over the separate channels V, S, M, L, but something more complex.
Here we need to say a little about how the brain combines the signals of the sensors. Each receptor reports just one thing: how strongly it is excited. A cone doesn't know what wavelength the light had, so the signal of a single receptor carries no precise information about the visible spectral color.
The sensation of color arises in the brain when the signals from different cones are compared with each other. The signals of the receptor array are regrouped into three opponent channels30–32: red–green (L versus M), yellow–blue (S versus the sum of L and M) and brightness (L + M), after which these channels are mixed again, creating the sensation of the hues we are used to. Very roughly:
A = 0.5·L + 0.5·M, RG = L − M, YB = S − 0.5·(L + M)
The sign and ratio of RG and YB set the hue33,34, A sets the brightness, and RG = YB = 0 gives white or gray. Say L = 100, M = 50, S = 10. Then A = 75, RG = +50 (the red side), YB = 10 − 75 = −65 (the yellow side). Red plus yellow is a saturated orange.
The diagrams use a model of instantaneous perception: the response to a stimulus at constant brightness, with adaptation fixed to neutral white. In real life the color signal accumulates over time, and neurons can even get overloaded with a color, adapting to it and shifting the norm toward the dominant color. This is the tinted-glasses effect: if you look through rose-colored glasses long enough, the sense of full color perception eventually returns, although the ability to tell neighboring hues apart will, of course, get worse.
This is behind illusions such as successive contrast and the negative (complementary) afterimage: stare at something red for a while, then look at a white sheet, and you'll see a greenish-cyan spot.
How this works for humans can be assessed right now on your display: the picture on it is formed by adding the light of R, G, B (and, less often, W) subpixels.
But for the same sensation of color, a chicken needs to take more of a spectral color with a weaker response, or less if the response is stronger. So the result of the addition has to be recalculated according to the color sensitivity curves.
To draw the diagram we will take two pure spectral colors pairwise (i.e. light of strictly one wavelength), mix them in different proportions and calculate the stimulus from the responses of the V/S/M/L cones. First we will get the result for the human, then pick the corresponding one for the chicken.
UV, as before, we denote with color noise (the density is set by the response of the UV cones). If in a given region the chicken perceives the color more strongly than the human, we make the color more saturated; otherwise, paler.
Axes: the horizontal and vertical axes are the wavelengths λ1 and λ2 of the pure colors (300–650 nm, including ultraviolet); each cell shows the result of mixing them 50 : 50 across the RGB channels.
For the human this is a simple average of the two colors. A human does not see ultraviolet: to the left of ~400 nm the blue channel simply decreases (down to zero by ~370 nm), and the other channels do not change.
On the right is the shift of the color balance in mixing: for red hues the color on the vertical (λ2) dominates in the mixture, for blue hues the color on the horizontal (λ1); brightness is the magnitude of the shift.
5. Color Wheels of Mixing Two Spectral Colors #
The same picture can be presented differently — as color wheels — and at the same time we can add different shares of the mixed-in pure spectral color. In each wheel the angle sets the wavelength of the first color λ1 (400–650 nm, clockwise from the left edge), and the radius sets the wavelength of the second color λ2 (400 nm at the center, 650 nm at the rim). The first color is taken with weight 100 %, the second with weight p = 25, 50, 75 and 100 % of the first. The human is shown at the top (weighted average of RGB), the chicken at the bottom: the saturation of colors is changed according to the perception weights, and UV is shown by noise (the density follows the sensitivity of the UV cone to the mixture).
6. The Human Color Space for Mixtures of Two Spectral Colors #
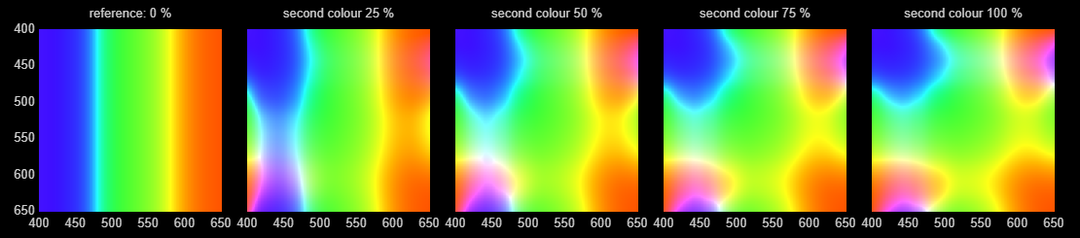
We move from illustrations to the full color space: we remove the illustrative boosting and weakening of saturation and add the colors as they are. We start with the human. The first square is the reference (the second color is mixed in at 0 %, i.e. the pure first color remains); in the others the share of the second color is 25, 50, 75 and 100 %. The horizontal axis is λ1 (the first color, weight 100 %), the vertical axis is λ2 (the second color, weight p of the first), both axes 400–650 nm. The stimulus is the sum of two spectral lines (power 1 and p), the responses of the S/M/L cones to it are added up, and the color is obtained from the total response (constant brightness).
7. The Chicken Color Space for Mixtures of Two Spectral Colors #
Now the same for the chicken. The squares are built the same way as for the human: a reference with 0 % of the second color and four squares with 25, 50, 75 and 100 %, both axes 400–650 nm. The responses of the four cones (V/S/M/L) are added up; the color from the S/M/L part is matched to the chicken colors from the other diagrams, without additional boosting or weakening of saturation. UV is shown by noise whose density is determined by the total response of the V cone.
8. Comparison of the Human and Chicken Color Spaces for Mixtures of Two Spectral Colors #
Now everything is ready to model the full color space of the chicken and compare how it differs from the human one. The human is shown on the left, the chicken on the right: the horizontal axis is λ1 (the first color), the vertical axis is λ2 (the second color), both axes 400–650 nm. In the animation, the admixture of the second spectral color smoothly grows from 0 to 100 % and just as smoothly decreases back. The stimulus is the sum of the responses of the S/M/L cones in the human and of the V/S/M/L cones in the chicken; the color from the chicken's responses is matched to the chicken colors from the other diagrams, and UV is shown by noise whose density is determined by the total response of the V cone.
We will pause the conversation about color here. In the next article we will take up the second part: we will talk about the chicken's viewing angles and binocularity (its eyes sit on the sides of the head and can move independently of each other, widening the field of view and losing binocularity, and when both start looking forward, the region of binocular vision returns), about visual acuity and how it changes from the center of the visual field to the periphery, about how the chicken focuses under these conditions, and also about how the brain reconstructs a coherent picture of the surrounding world from all this. And then we will put everything together: the color vision from this article, the viewing geometry, and the acuity — into a model that lets a human look at the surroundings through a chick's eyes.
The interactive originals of all the diagrams (drawn in the browser with JavaScript), together with explanations, are collected in the short version of the article.
References #
Evolution of vertebrate color vision #
- Bowmaker J.K. Evolution of colour vision in vertebrates // Eye. 1998. Vol. 12, Pt. 3b. P. 541–547. https://doi.org/10.1038/eye.1998.143 #
- Bowmaker J.K. Evolution of vertebrate visual pigments // Vision Research. 2008. Vol. 48, No. 20. P. 2022–2041. https://doi.org/10.1016/j.visres.2008.03.025 #
- Baden T., Osorio D. The retinal basis of vertebrate color vision // Annual Review of Vision Science. 2019. Vol. 5. P. 177–200. https://doi.org/10.1146/annurev-vision-091718-014926 #
- Shi Y., Yokoyama S. Molecular analysis of the evolutionary significance of ultraviolet vision in vertebrates // Proceedings of the National Academy of Sciences. 2003. Vol. 100, No. 14. P. 8308–8313. https://doi.org/10.1073/pnas.1532535100 #
The nocturnal bottleneck and opsin reduction in mammals #
- Gerkema M.P., Davies W.I.L., Foster R.G., Menaker M., Hut R.A. The nocturnal bottleneck and the evolution of activity patterns in mammals // Proceedings of the Royal Society B. 2013. Vol. 280, No. 1765. 20130508. https://doi.org/10.1098/rspb.2013.0508 #
- Borges R., Johnson W.E., O'Brien S.J. et al. Adaptive genomic evolution of opsins reveals that early mammals flourished in nocturnal environments // BMC Genomics. 2018. Vol. 19. P. 121. https://doi.org/10.1186/s12864-017-4417-8 #
- Davies W.I.L., Collin S.P., Hunt D.M. Molecular ecology and adaptation of visual photopigments in craniates // Molecular Ecology. 2012. Vol. 21, No. 13. P. 3121–3158. https://doi.org/10.1111/j.1365-294X.2012.05617.x #
Evolution of trichromacy in primates #
- Dulai K.S., von Dornum M., Mollon J.D., Hunt D.M. The evolution of trichromatic color vision by opsin gene duplication in New World and Old World primates // Genome Research. 1999. Vol. 9, No. 7. P. 629–638. https://doi.org/10.1101/gr.9.7.629 #
- Carvalho L.S., Pessoa D.M.A., Mountford J.K., Davies W.I.L., Hunt D.M. The genetic and evolutionary drives behind primate color vision // Frontiers in Ecology and Evolution. 2017. Vol. 5. P. 34. https://doi.org/10.3389/fevo.2017.00034 #
Mesopic vision #
- Zele A.J., Cao D. Vision under mesopic and scotopic illumination // Frontiers in Psychology. 2015. Vol. 5. P. 1594. https://doi.org/10.3389/fpsyg.2014.01594 #
The lens as a UV filter, and UV vision #
- Griswold M.S., Stark W.S. Scotopic spectral sensitivity of phakic and aphakic observers extending into the near ultraviolet // Vision Research. 1992. Vol. 32, No. 9. P. 1739–1743. https://doi.org/10.1016/0042-6989(92)90166-G #
- Hunt D.M., Carvalho L.S., Cowing J.A. et al. Spectral tuning of shortwave-sensitive visual pigments in vertebrates // Photochemistry and Photobiology. 2007. Vol. 83, No. 2. P. 303–310. https://doi.org/10.1562/2006-06-27-IR-952 #
- Tan Z., Sun W., Chen T.-W., Kim D., Ji N. Neuronal representation of ultraviolet visual stimuli in mouse primary visual cortex // Scientific Reports. 2015. Vol. 5. 12597. https://doi.org/10.1038/srep12597 #
Age-related changes in lens transmittance #
- Weale R.A. Age and the transmittance of the human crystalline lens // The Journal of Physiology. 1988. Vol. 395. P. 577–587. https://doi.org/10.1113/jphysiol.1988.sp016935 #
- Kessel L., Lundeman J.H., Herbst K., Andersen T.V., Larsen M. Age-related changes in the transmission properties of the human lens and their relevance to circadian entrainment // Journal of Cataract & Refractive Surgery. 2010. Vol. 36, No. 2. P. 308–312. https://doi.org/10.1016/j.jcrs.2009.08.035 #
- Artigas J.M., Felipe A., Navea A., Fandiño A., Artigas C. Spectral transmission of the human crystalline lens in adult and elderly persons // Investigative Ophthalmology & Visual Science. 2012. Vol. 53, No. 7. P. 4076–4084. https://doi.org/10.1167/iovs.12-9471 #
Senile miosis and retinal illuminance #
- Winn B., Whitaker D., Elliott D.B., Phillips N.J. Factors affecting light-adapted pupil size in normal human subjects // Investigative Ophthalmology & Visual Science. 1994. Vol. 35, No. 3. P. 1132–1137. PMID: 8125724. #
Spectral sensitivity of human cones #
- Smith V.C., Pokorny J. Spectral sensitivity of the foveal cone photopigments between 400 and 500 nm // Vision Research. 1975. Vol. 15, No. 2. P. 161–171. https://doi.org/10.1016/0042-6989(75)90203-5 #
- Stiles W.S., Burch J.M. N.P.L. colour-matching investigation: final report (1958) // Optica Acta. 1959. Vol. 6, No. 1. P. 1–26. https://doi.org/10.1080/713826267 #
- Stockman A., MacLeod D.I.A., Johnson N.E. Spectral sensitivities of the human cones // Journal of the Optical Society of America A. 1993. Vol. 10, No. 12. P. 2491–2521. https://doi.org/10.1364/JOSAA.10.002491 #
- Stockman A., Sharpe L.T. The spectral sensitivities of the middle- and long-wavelength-sensitive cones derived from measurements in observers of known genotype // Vision Research. 2000. Vol. 40, No. 13. P. 1711–1737. https://doi.org/10.1016/S0042-6989(00)00021-3 #
Spectral sensitivity and pigments #
- Bowmaker J.K., Knowles A. The visual pigments and oil droplets of the chicken retina // Vision Research. 1977. Vol. 17, No. 7. P. 755–764. https://doi.org/10.1016/0042-6989(77)90117-1 #
- Govardovskii V.I., Zueva L.V. Visual pigments of chicken and pigeon // Vision Research. 1977. Vol. 17, No. 4. P. 537–543. https://doi.org/10.1016/0042-6989(77)90052-9 #
- Bowmaker J.K., Heath L.A., Wilkie S.E., Hunt D.M. Visual pigments and oil droplets from six classes of photoreceptor in the retinas of birds // Vision Research. 1997. Vol. 37, No. 16. P. 2183–2194. https://doi.org/10.1016/S0042-6989(97)00026-6 #
- Prescott N.B., Wathes C.M. Spectral sensitivity of the domestic fowl (Gallus g. domesticus) // British Poultry Science. 1999. Vol. 40, No. 3. P. 332–339. https://doi.org/10.1080/00071669987412 #
Tetrachromacy and color vision #
- Osorio D., Vorobyev M., Jones C.D. Colour vision of domestic chicks // Journal of Experimental Biology. 1999. Vol. 202, No. 21. P. 2951–2959. https://doi.org/10.1242/jeb.202.21.2951 #
- Olsson P., Lind O., Kelber A. Bird colour vision: behavioural thresholds reveal receptor noise // Journal of Experimental Biology. 2015. Vol. 218, No. 2. P. 184–193. https://doi.org/10.1242/jeb.111187 #
Reviews and modeling #
- Hart N.S. The visual ecology of avian photoreceptors // Progress in Retinal and Eye Research. 2001. Vol. 20, No. 5. P. 675–703. https://doi.org/10.1016/S1350-9462(01)00009-X #
- Wilby D., Toomey M.B., Olsson P., Frederiksen R., Cornwall M.C., Oulton R., Kelber A., Corbo J.C., Roberts N.W. Optics of cone photoreceptors in the chicken (Gallus gallus domesticus) // Journal of the Royal Society Interface. 2015. Vol. 12, No. 111. 20150591. https://doi.org/10.1098/rsif.2015.0591 #
Reviews of the mechanisms combining cone signals #
- Solomon S.G., Lennie P. The machinery of colour vision // Nature Reviews Neuroscience. 2007. Vol. 8, No. 4. P. 276–286. https://doi.org/10.1038/nrn2094 #
Transformation and integration of opponent signals in the cortex #
- Li P., Garg A.K., Zhang L.A. et al. Cone opponent functional domains in primary visual cortex combine signals for color appearance mechanisms // Nature Communications. 2022. Vol. 13. 6344. https://doi.org/10.1038/s41467-022-34020-2 #
- De Valois R.L., Cottaris N.P., Elfar S.D., Mahon L.E., Wilson J.A. Some transformations of color information from lateral geniculate nucleus to striate cortex // Proceedings of the National Academy of Sciences. 2000. Vol. 97, No. 9. P. 4997–5002. https://doi.org/10.1073/pnas.97.9.4997 #
Models of normalization and relative combination of cone signals #
- Rezeanu D., Neitz M., Neitz J. From cones to color vision: a neurobiological model that explains the unique hues // Journal of the Optical Society of America A. 2023. Vol. 40, No. 3. P. A1–A8. https://doi.org/10.1364/JOSAA.477227 #
- Neitz J., Neitz M. Neurobiological hypothesis of color appearance and hue perception // Journal of the Optical Society of America A. 2014. Vol. 31, No. 4. P. A195–A207. https://doi.org/10.1364/JOSAA.31.00A195 #
- Vorobyev M., Osorio D. Receptor noise as a determinant of colour thresholds // Proceedings of the Royal Society of London. Series B: Biological Sciences. 1998. Vol. 265, No. 1394. P. 351–358. https://doi.org/10.1098/rspb.1998.0302 #
Author: ymik · November 19, 2026